Analytics and Reporting: How to Interpret Data and Turn Insights into Actionable Strategies

Analytics and Reporting: How to Interpret Data and Turn Insights into Actionable Strategies
Data is everywhere. It's collected by our smartphones, our laptops, our smartwatches, and even our refrigerators. For businesses, this data holds the key to understanding customer behavior, optimizing operations, and ultimately driving growth. But having data is not enough. The real challenge lies in interpreting this data accurately and turning insights into actionable strategies. This blog post aims to demystify the process of data analytics and reporting, offering practical tips and tools to help you make informed decisions.

The Importance of Analytics and Reporting
The primary goal of analytics and reporting is to convert raw data into meaningful information. This process enables businesses to:
- Understand Customer Behavior: By analyzing patterns and trends, companies can gain insights into customer preferences, purchasing habits, and pain points.
- Optimize Operations: Data helps identify inefficiencies and areas for improvement, leading to cost savings and better resource allocation.
- Drive Strategic Decisions: Informed decisions are crucial for long-term success. Analytics provides the evidence needed to justify investments, changes, and new initiatives.
Understanding and utilizing analytics and reporting can differentiate between a business that thrives and one that struggles to stay afloat.
What is Data Analytics?
Data analytics involves examining datasets to draw conclusions about the information they contain. This process can be broken down into several key steps:
- Data Collection: Gathering data from various sources such as customer surveys, sales records, website analytics, and social media interactions.
- Data Cleaning: Ensuring the data is accurate and usable by removing duplicates, correcting errors, and filling in missing information.
- Data Analysis: Applying statistical methods and algorithms to discover patterns, correlations, and trends.
- Data Interpretation: Translating the findings into understandable and actionable insights.
How to Apply Data Analytics: A Step-by-Step Guide
Step 1: Define Your Objectives
Before diving into data analysis, it's crucial to clearly define what you want to achieve. Are you looking to increase sales, improve customer satisfaction, or optimize marketing efforts? Having a clear objective will guide your analysis and ensure you focus on relevant data.
Step 2: Collect Relevant Data
The quality of your insights depends on the quality of your data. Collect data from multiple sources to get a comprehensive view. For example:
- Sales Data: Understand what products are selling, when, and to whom.
- Customer Feedback: Gather opinions through surveys, reviews, and social media comments.
- Website Analytics: Track user behavior, traffic sources, and conversion rates.
Step 3: Clean Your Data
Raw data is often messy. Duplicate entries, missing values, and errors can skew your results. Use data cleaning tools like OpenRefine or Talend to ensure your data is accurate and ready for analysis.
Step 4: Analyze the Data
Choose the right tools and methods for your analysis. Some popular data analytics tools include:
- Google Analytics: Great for web traffic analysis.
- Tableau: Excellent for data visualization.
- Microsoft Power BI: Powerful for business analytics.
Apply statistical methods to identify patterns and trends. For example, you might use regression analysis to understand the relationship between advertising spend and sales revenue.
Step 5: Interpret the Results
The goal of data interpretation is to turn raw numbers into actionable insights. Ask yourself questions like:
- What patterns or trends do I see?
- What are the potential causes of these patterns?
- How do these insights align with my business objectives?
Step 6: Communicate Your Findings
Effective communication is key to turning insights into action. Use visual aids like charts, graphs, and dashboards to present your findings in an easily digestible format. Tools like Tableau and Microsoft Power BI are excellent for creating visually appealing reports.
Step 7: Implement Actionable Strategies
Based on your insights, develop strategies to achieve your objectives. For instance:
- Marketing Strategy: If data shows a particular demographic is more likely to purchase your product, tailor your marketing efforts to target that group.
- Product Development: If customer feedback indicates a common pain point, consider making improvements to address it.
- Operational Efficiency: If data reveals inefficiencies in your supply chain, explore ways to streamline processes.
Tips and Tricks for Effective Data Analytics
- Start Small: Begin with a small dataset or a specific area of your business. This will make the process more manageable and less overwhelming.
- Focus on Quality, Not Quantity: High-quality data is more valuable than large quantities of inaccurate or irrelevant data.
- Use Automation: Leverage automation tools to save time on collecting, preparing and organizing your data .
- Keep It Simple: Avoid overcomplicating your analysis. Focus on the key metrics that matter most to your objectives.
- Stay Updated: Data trends and technologies are constantly evolving. Stay informed about the latest tools and best practices.
Relevant Tools for Data Analytics and Reporting
Here are some essential tools to help you get started with data analytics and reporting:
- Google Analytics: Ideal for tracking and analyzing website traffic and user behavior.
- Tableau: A powerful data visualization tool that helps transform raw data into interactive, easy-to-understand dashboards.
- Microsoft Power BI: Provides robust analytics and visualization capabilities, perfect for business intelligence.
- R and Python: Popular programming languages for data analysis and statistical computing.
- Excel: A versatile tool for data manipulation, analysis, and visualization.
- Looker: A data platform that offers data exploration and business intelligence capabilities.
Conclusion
Analytics and reporting are more than just buzzwords; they are essential components of modern business strategy. By effectively interpreting data and turning insights into actionable strategies, businesses can stay ahead of the competition, meet customer needs, and achieve their goals. Remember, the journey from data to decision is a continuous process of learning and adaptation. Start small, focus on quality, and leverage the right tools to make data-driven decisions that drive success.
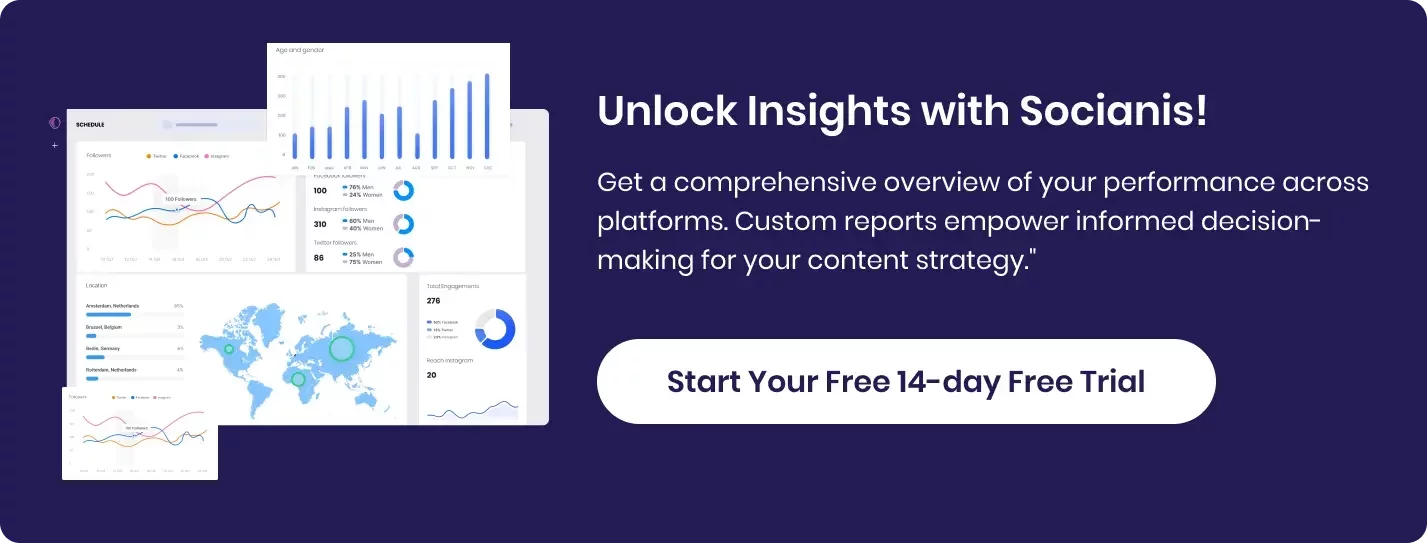
For those looking to gain deeper insights into customer behavior on social media platforms, consider using a social media management tool like Socianis. Our tool not only helps you manage your social media presence but also provides detailed analytics to understand your audience better and tailor your strategies accordingly.
With the right approach and tools, you can transform your data into a powerful asset, guiding your business toward greater efficiency and growth.

